

Powerful Dashboards insights made
10x Awesome
Deploy custom or prebuild odoo dashboards with Techfinna. Easy to integrate, fully customizable, and scalable solutionswithout having to worry about styling and animations.
Solutions built for analytics
Best Dashboards for your Business
Plug n play dashboards to supercharge your data analytics and reporting.
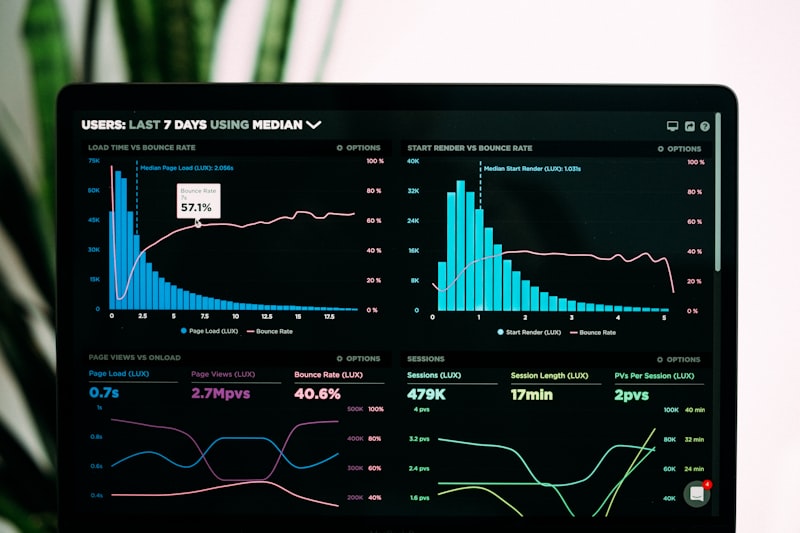
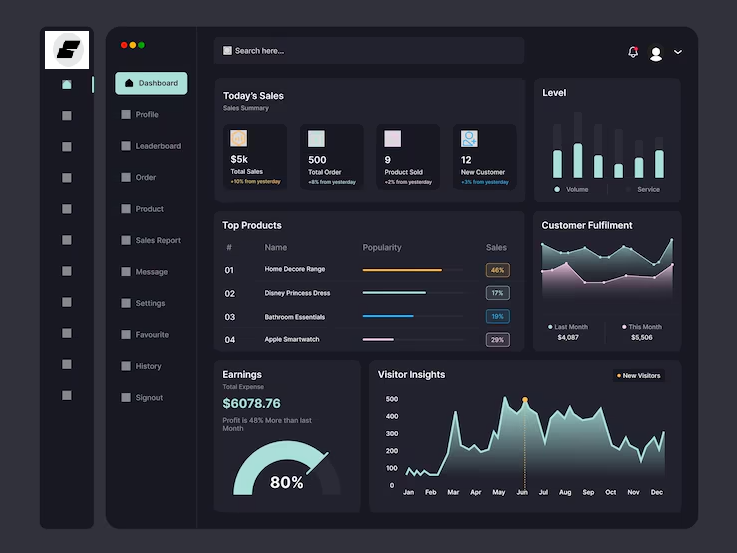
Sales Intelligence
Make decisions in minutes, not months
Surface revenue trends and conversion funnels in real-time. Drill down by channel, region, or cohort with zero lag.
- Live metrics and anomaly alerts
- Conversion funnel breakdowns
- Total Sales, Margin, COGS KPI's
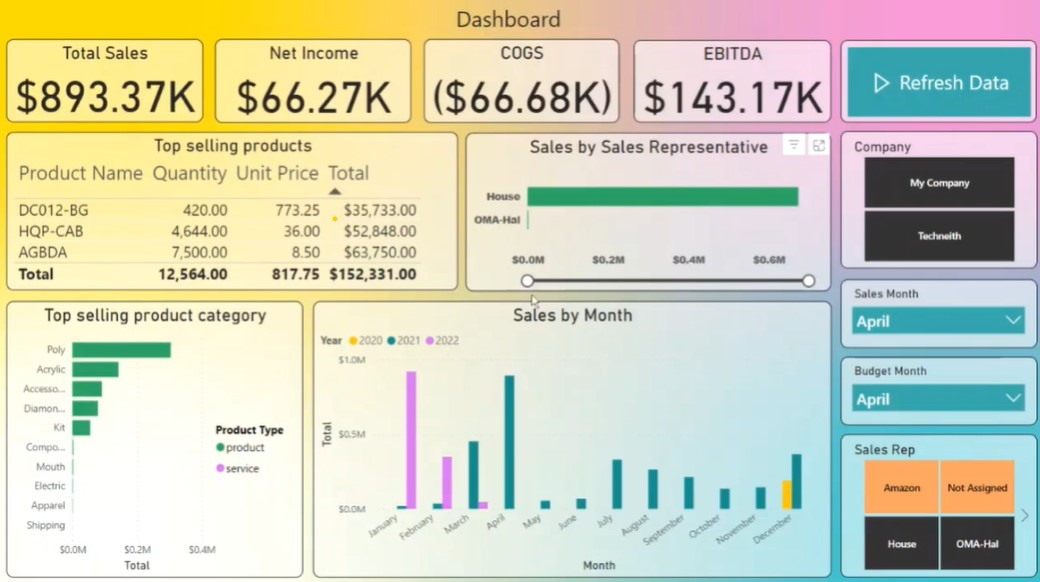
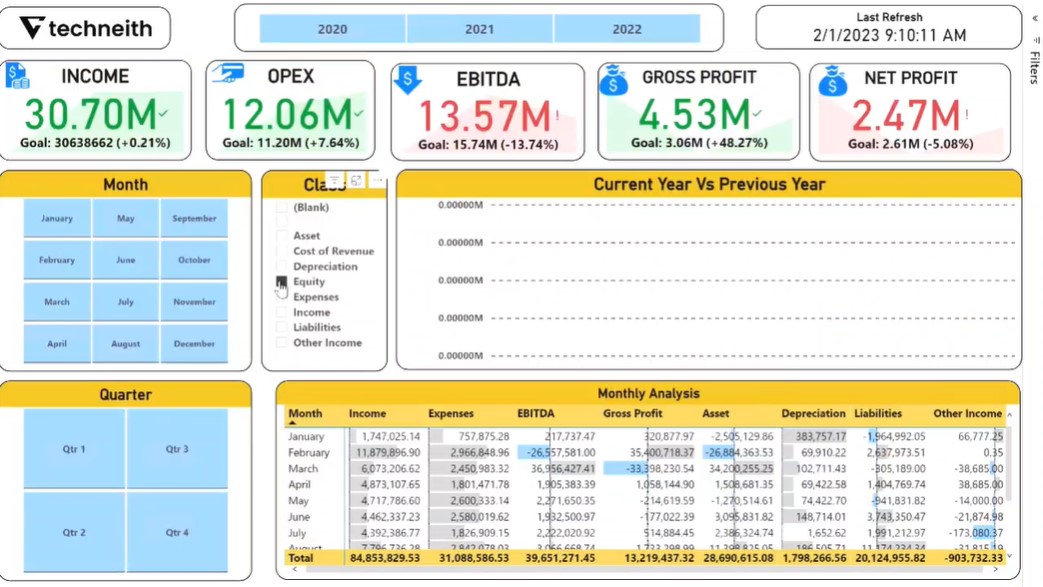
Budget Sales Dashboard
Budget your future ahead without spreadsheets
Realtime data, with EBITDA, COGS and Net Income from your Budget Sales Dashboard
- EBITDA - Earning before interest, tax, depreciation and amortization
- COGS - Cost of goods sold
- Dashboard Slicers
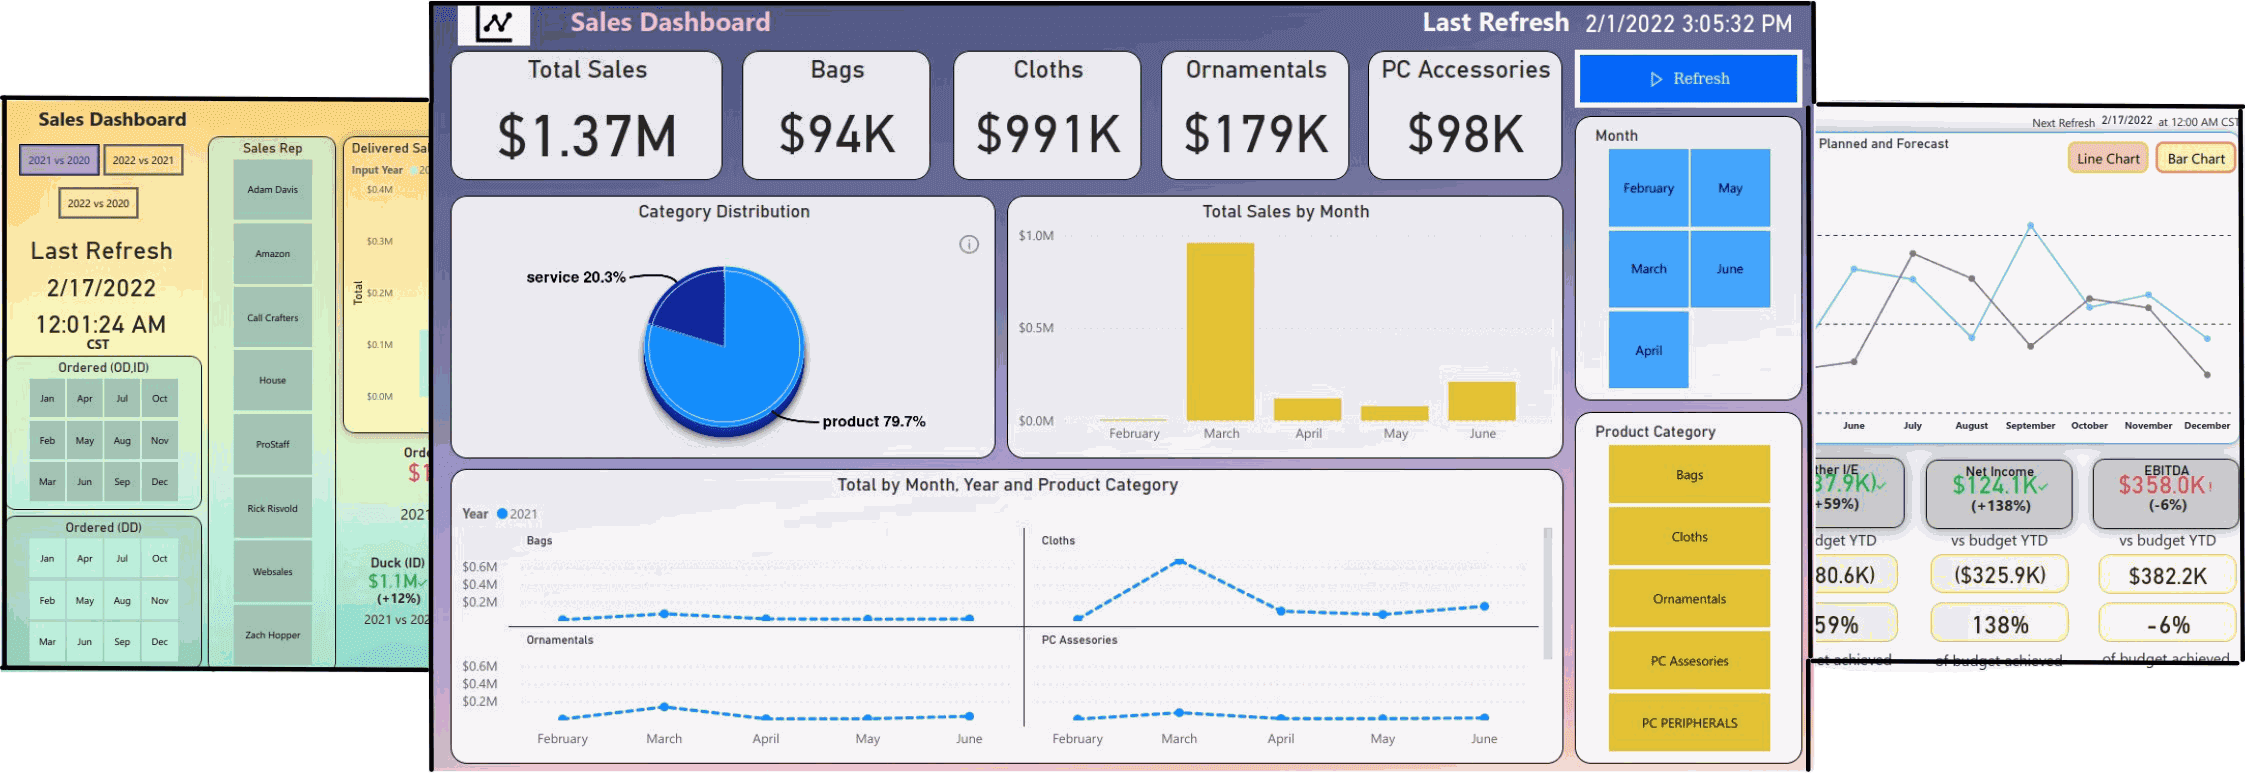
Profit & Loss Dashboard
Understand Profit & Loss of your data
Plan with confidence using scenario modeling and instant rollups. Share links your team will actually understand.
- OPEX - Operating Expenses
- Scenario planning
- Gross Profit - Before deduction
Prebuilt Dashboards using PowerBI and Looker
Elevate your business intelligence with our cutting-edge dashboard solutions, featuring real-time analytics and intuitive visualizations.

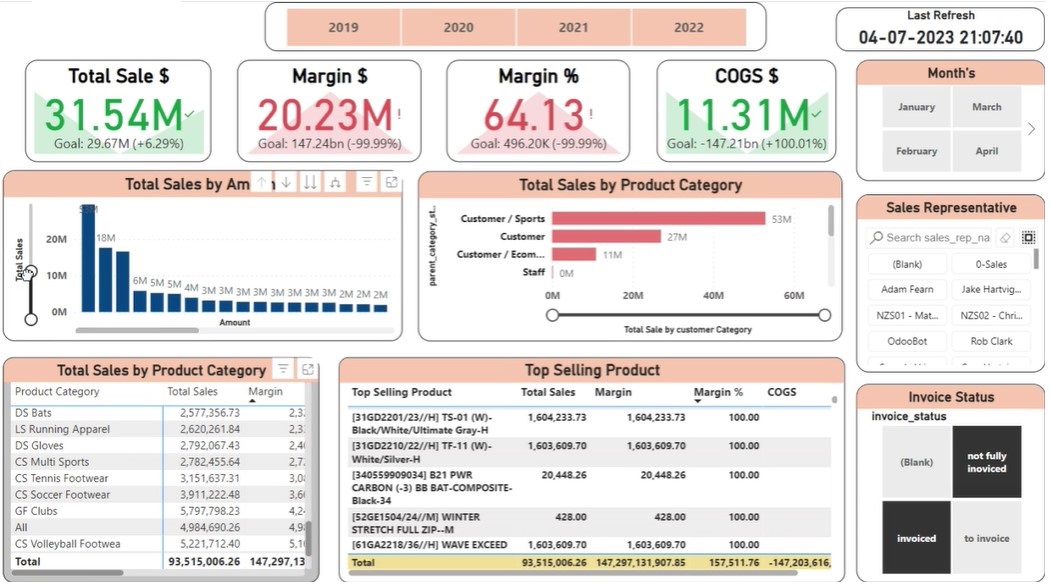
Sales Analytics
Real-time sales performance tracking with predictive insights and conversion optimization for maximum revenue growth.
Key Features:

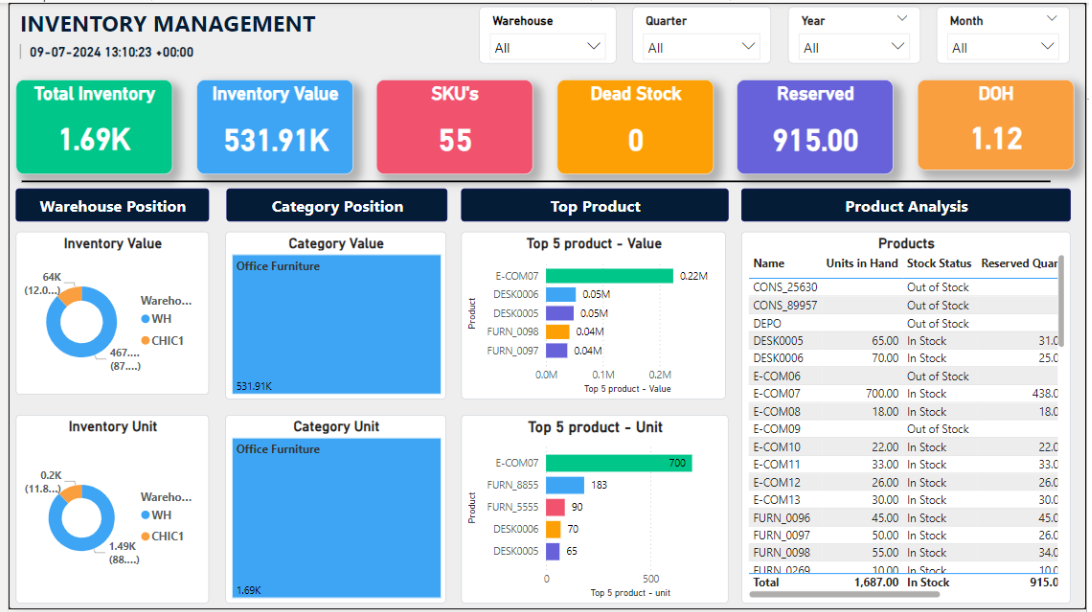
Inventory Intelligence
Smart inventory management with automated alerts and supply chain optimization to prevent stockouts.
Key Features:

Financial Overview
Comprehensive financial metrics with interactive charts and budget forecasting for informed decision making.
Key Features:

Performance Metrics
Advanced performance tracking with KPI monitoring and automated reporting for business intelligence.
Key Features:
Easy Plug n Play in your App
Easily build & deploy dashboards in your web in minutes. Fully customizable, accessible, and optimized for real-time data visualization
import Highcharts from "highcharts";
import HighchartsReact from "highcharts-react-official";
import type { HighchartsReactProps } from "highcharts-react-official";

interface SalesChartProps {
  title?: string;
  data: number[];
  categories: string[];
  seriesName?: string;
  color?: string;
}

export default function SalesChart({ title = 'Monthly Sales Performance',
    data,
    categories,
    seriesName = 'Sales',
    color = '#3b82f6',
  }: SalesChartProps, ) {
  const options: Highcharts.Options = {
    chart: {
      type: 'line',
      backgroundColor: '#1a1a1a',
      style: {
        fontFamily: 'Inter, sans-serif',
      ,},
    ,},
    title: {
      text: title,
      style: { color: '#e5e7eb' },
    ,},
    xAxis: {
      categories: categories,
      labels: { style: { color: '#9ca3af' } },
    ,},
    yAxis: {
      title: {
        text: 'Sales ($)',
        style: { color: '#9ca3af' },
      ,},
      labels: { style: { color: '#9ca3af' } },
    ,},
    series: [{
      name: seriesName,
      data: data,
      color: color,
    ,}],
    credits: { enabled: false },
    accessibility: { // Add accessibility for better inclusivity
      enabled: true,
      description: `Line chart showing seriesName over time.`,
    ,},
  ,};

  return (
    <div className="rounded-xl border bg-zinc-900/60 p-6">
      <HighchartsReact highcharts={Highcharts} options={options} />
    </div>
  );
}AI Powered Odoo Dashboards
TechFinna’s AI-Powered Odoo Dashboards let you pick fields, preview data live, and combine them into a single, clean dataset—then instantly generate smart, KPI‑driven dashboards. Customize charts, apply filters, and chat with your data to get back to analysis faster.
- One-step installation
- Interactive dataset builder (no SQL)
- Live row preview while you build
- Token-based, secure connection
- Automate dataset creation
- Interactive dashboard editing
- AI chatbot assistance
- Advanced filters for deep analysis

Why Choose TechFinna?
Industry-leading expertise in dashboard creation with seamless integration across platforms
Odoo Implementation
Implement odoo dashboards and business analytics with Techfinna
Odoo Customization
Customize odoo dashboards and modules with us
Custom Dashboards
Create custom dashboards with us using Power BI and Google Looker Studio
Power BI/Looker Powered Dashboards
Connect with our expert team to create and customize
Business Intelligence Suite
Complete BI solution with advanced analytics and machine learning integration
Interactive Visualizations
Dynamic charts, graphs, and reports that respond to user interactions in real-time
Real Time Updates
One click refresh and all the data is done
Expert Team
Experienced team in dashboard creation and modification using Microsoft PowerBI and Google Looker Studio

Shumal Saifi
Senior Data Analyst

Chandan Sharma
Data Visualization Expert

Rajat Rai
Business Intelligence Lead
Client Success Stories
Ready to Transform Your Data?
Join 500+ companies that trust TechFinna for their dashboard solutions