"Unlocking Inventory Insights: Building an Odoo Dashboard in Power BI"
Optimizing inventory is crucial for businesses. It helps cut costs, boost efficiency, and please customers. Businesses seeking to enhance their inventory practices can tailor it to their needs. Departments need to have strong ownership of their pipelines, data at their fingertips, and accurate information at any given point in time.
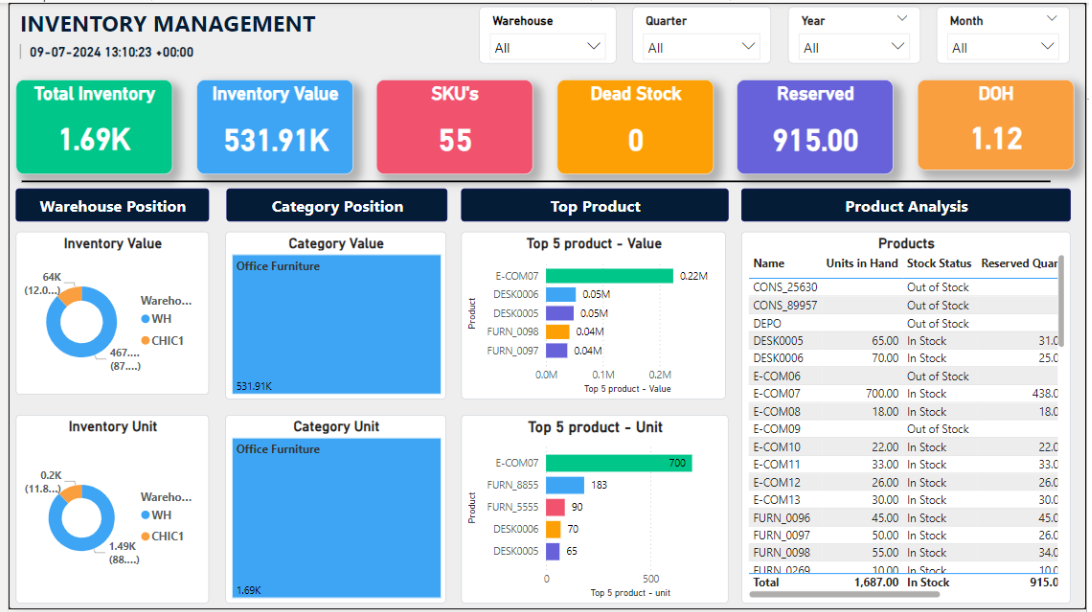
Combining Odoo’s comprehensive Inventory Management with Power BI’s visualization capabilities allows businesses to gain deeper insights into their inventory operations. In this blog, we will guide you through creating an inventory dashboard by connecting Odoo to Power BI Desktop.
Benefits of Inventory Management Dashboard in Power BI
- Streamlines inventory processes, helping businesses operate more cost-effectively and efficiently.
- Provides real-time data and analytics, empowering businesses to make informed decisions, optimize inventory, and adapt to changing markets.
- Power BI helps to enhance visibility through interactive KPIs, improves cost reduction, and enables better decision-making.
Step-by-Step Guide
1. Connect Odoo with Power BI Desktop
- Install the Techfinna Odoo Power BI Connector to integrate your Odoo database and Power BI Desktop.
- Provide the necessary credentials for the Power BI connector to connect your Odoo database from your Odoo settings.
- Import relevant inventory data tables, such as production information, stock levels, purchase orders, and sales orders.
2. Define Your Dashboard Requirements
- Warehouse Performance: Track fulfillment rates and order accuracy.
- Repeat Order Analysis: Identify which products have a repeat order rate.
- Stock Movement & Levels: Visualize incoming and outgoing stock trends and monitor real-time inventory across warehouses.
3. Design Your Dashboard
Once the data is imported, you can start designing your dashboard:
- Add Key Metrics: Use Power BI card visuals to display total stock value, available stock units, and reorder alerts.
- Create Visuals for Insights: Add pie charts to display inventory distribution by category or warehouse, and use bar charts for stock movement trends.
- Highlight Critical Inventory: Apply conditional formatting to highlight low-stock items or items nearing expiration.
- Filters and Slicers: Add slicers to filter data by product category, time frame, or warehouse.
4. Leverage Power BI Desktop Features
- Use the drill-down feature to analyze specific products or categories in detail.
- Create custom calculations to derive additional insights, such as average inventory turnover ratio or average inventory holding period.
- Use time intelligence features to compare year-over-year trends and track seasonal fluctuations.
- Leverage Techfinna's ready-made Odoo Inventory Management Dashboard.

5. Automate Data Refresh
- Set up a scheduled refresh in Power BI Service for automated updates.
- Leverage the connector’s capabilities for real-time data synchronization.
Conclusion
Creating an Odoo inventory management dashboard in Power BI Desktop empowers businesses with interactive, real-time data visuals, optimized stock levels, and improved efficiency. Tools like the Techfinna Odoo Power BI Connector make the process faster and more reliable.
Need help integrating Odoo with Power BI? Contact us for more benefits and support at info@techfinna.com.


